This year’s Kantar Information is Beautiful longlist was released today, and we scanned through all 22 pages of entries and picked out a few favourites. With so many things to look at, it’s the ones that convey their message simply that seem to stand out.
Life span of news cycles – Google News Lab, with Alberto Cairo and Schema
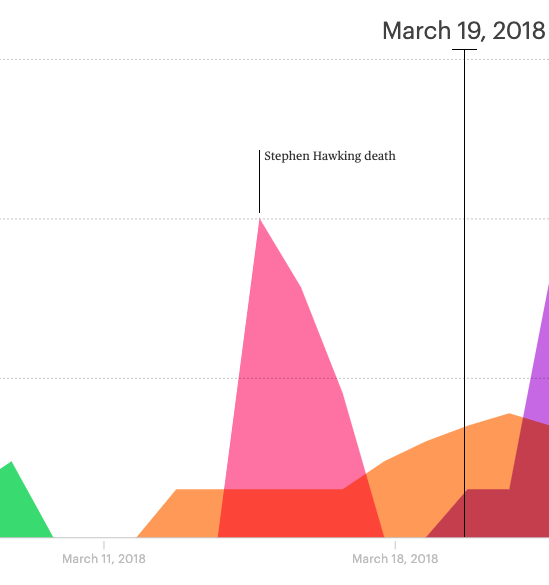
“Which stories stay longest in the public view, and which ones fade away?” This is a simple layered area chart, but is backed by some big data, a clean UI and a surprising emotional impact. The scrubber allows you to move back and forth through time, seeing the characteristic shapes that different news stories create in the public consciousness of internet searches.
There’s the painful spikes of obituaries, which burst into view but drop away into the abyss as their news value passes:
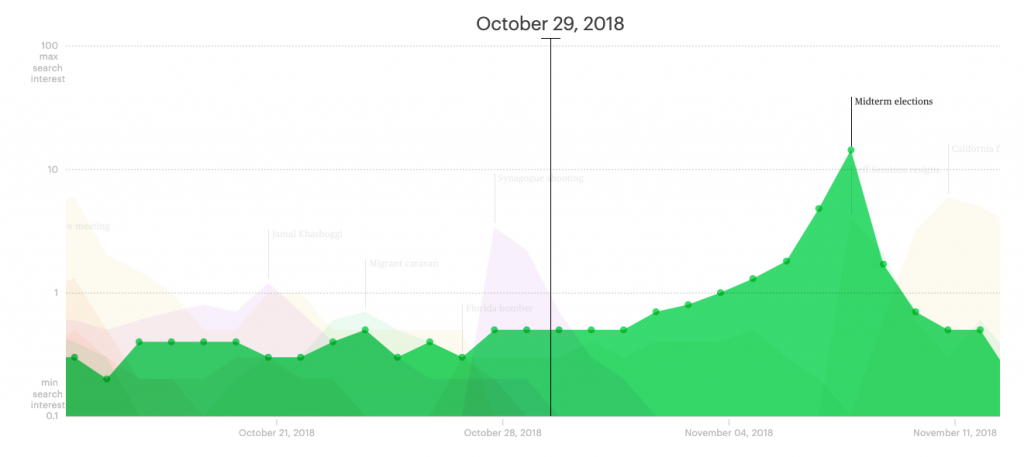
The slow burn of an election campaign, rising to a crescendo and then echoing away:
And the opposite shape, the crime and investigation, where a spike is followed by a drawn-out denouement:
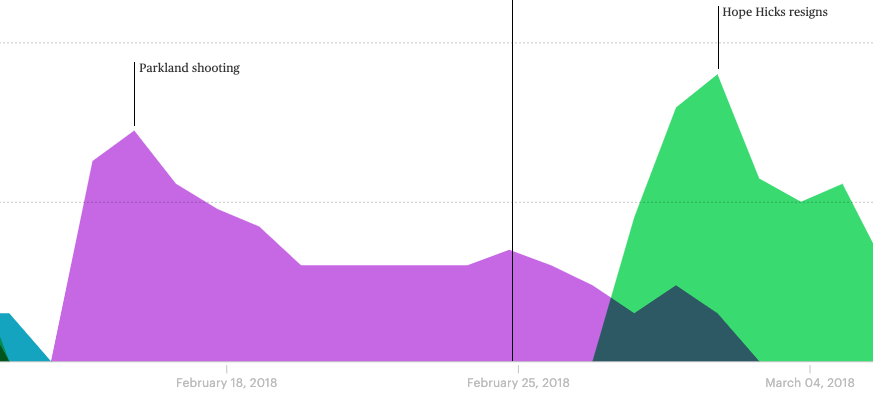
There’s a kind of quiet tragedy to the way these major events are rendered into simple and almost predictable shapes, and the way relative trivialities (the Roseanne show being cancelled) often overshadow more important items. Which one did I click on myself?
How India Mobilised A Million Polling Stations: Reuters
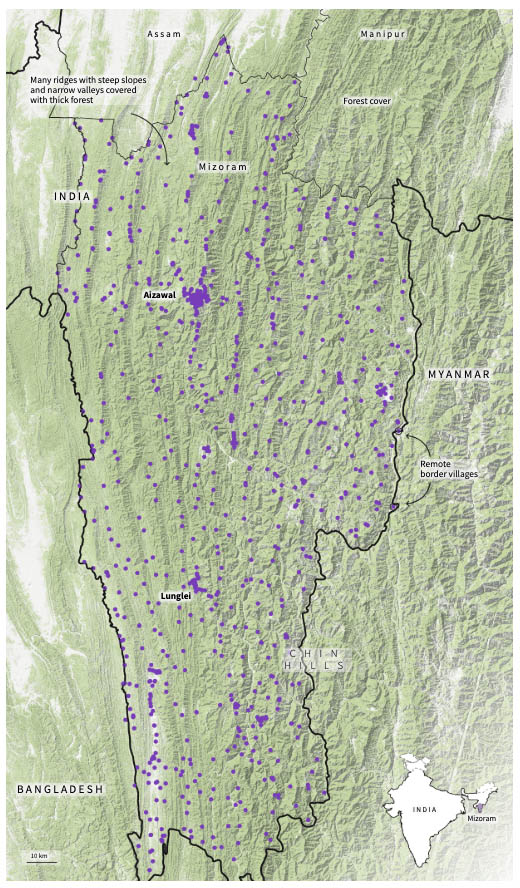
There’s a similar sense of epic scale behind this data journalism piece by Reuters. What’s involved in organising a million polling stations over some of the most diverse and treacherous inhabited terrain of any country?
The beautiful maps are sparingly annotated to tell a story, about the way humanity, geography and democracy are intertwined. There are maps of sparse hill stations, fertile plains with big cities, and the steep forested country of India’s far east, where humanity follows the lines of the valleys:
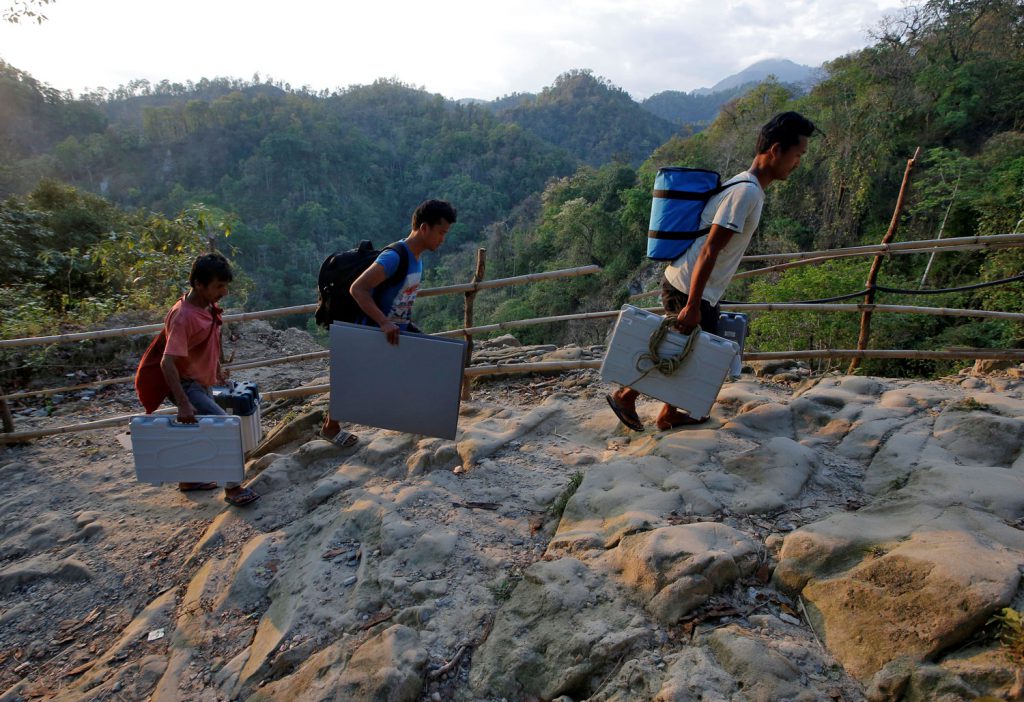
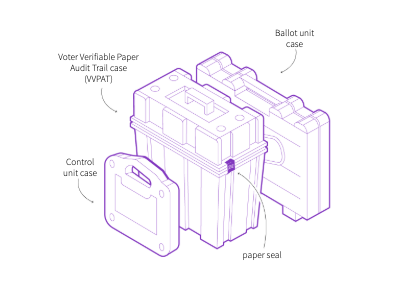
Carrying Voter Verifiable Paper Audit Trail (VVPAT) machines and Electronic Voting Machines (EVM) forest in the eastern state of West Bengal. REUTERS/Rupak De Chowdhuri
Sleep blanket – Seung Lee
The graph itself might not be highly original, but the medium and execution are great. For every day of the first year of his son’s life, Seung Lee stitched a row of this blanket representing his sleep patterns:
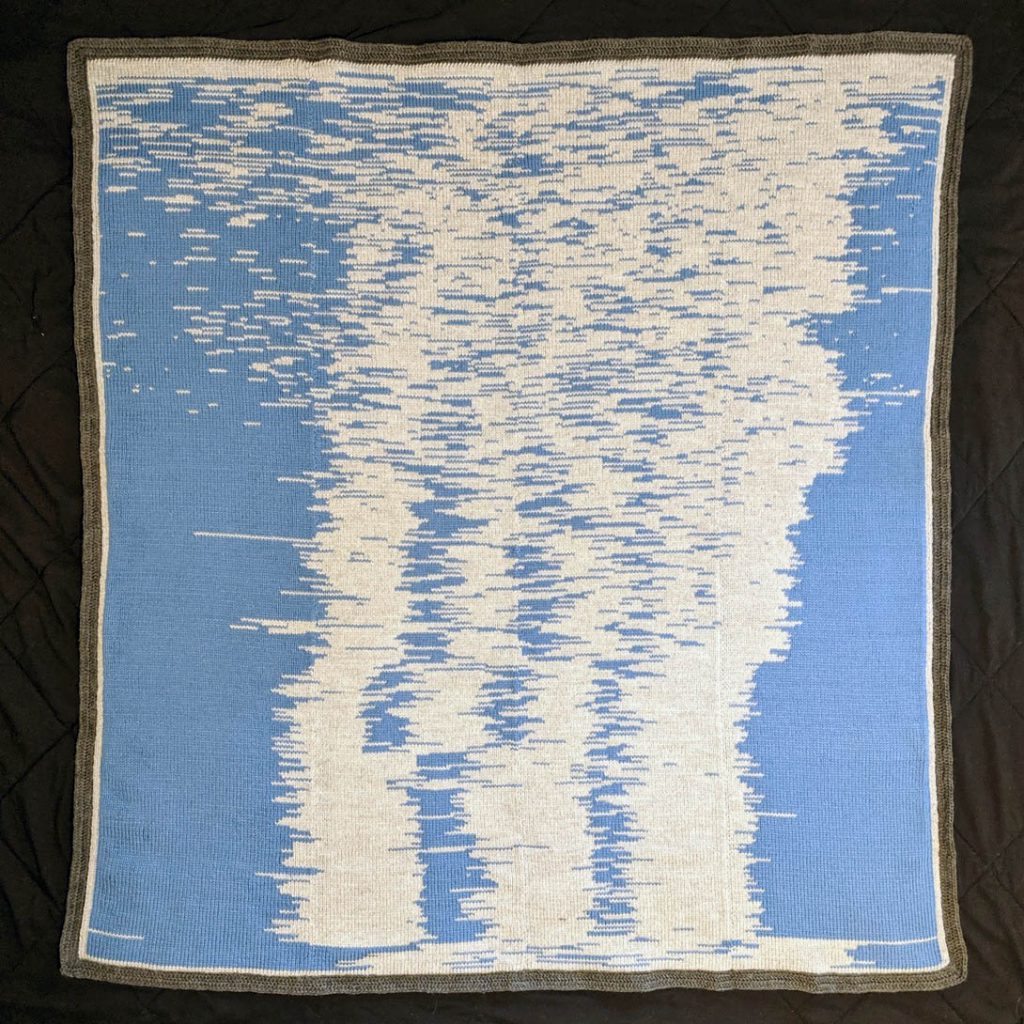
Each stitch represents 6 minutes of time (white is sleep, presumably, though it might have been clearer the other way around). Parents will probably feel the pain of the erratic early months, but there’s also a beautiful story of human development in the gradually establishing pattern of regular sleep.
Some other great visualisations:
- How is a JPEG made? Find out, and make some interesting glitch art in the process. (Matthew Conlen & Victoria Uren)
- How to identify fake news on Twitter, using data (Giorgia Lupi – Accurat)
- Visualising religious diversity in US cities (Arushi Singh, Northeastern University)