How the BBC Visual and Data Journalism team works
with graphics in R
It’s always the best when people share their learnings. That’s why we appreciate BBC’s insights about creating graphics with R. The technical details they give are quite rich, especially the insights around the use of the ggplot2 library. It’s very helpful to compare their way of doing things with our own process, and learn from the challenges they were facing. Well done!
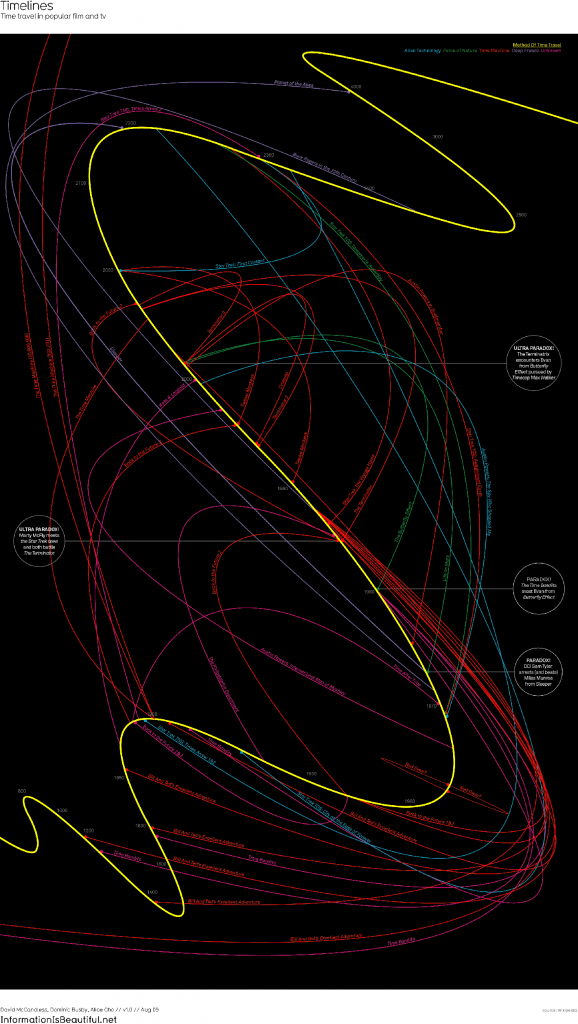
Time travel in popular film and TV
This project by Information is Beautiful visualises time travellers of popular film and television.
It’s particularly impressive how the creators managed to de-cluster the time between 1900 and 2100 by zooming in, resulting in a spaghetti type visual. As a viewer you only notice the zoom when paying close attention to the time labels on the yellow line which represents the primary time dimension.
While the project is fairly old (2009) it was recently resurrected by a tweet from @infobeautiful.
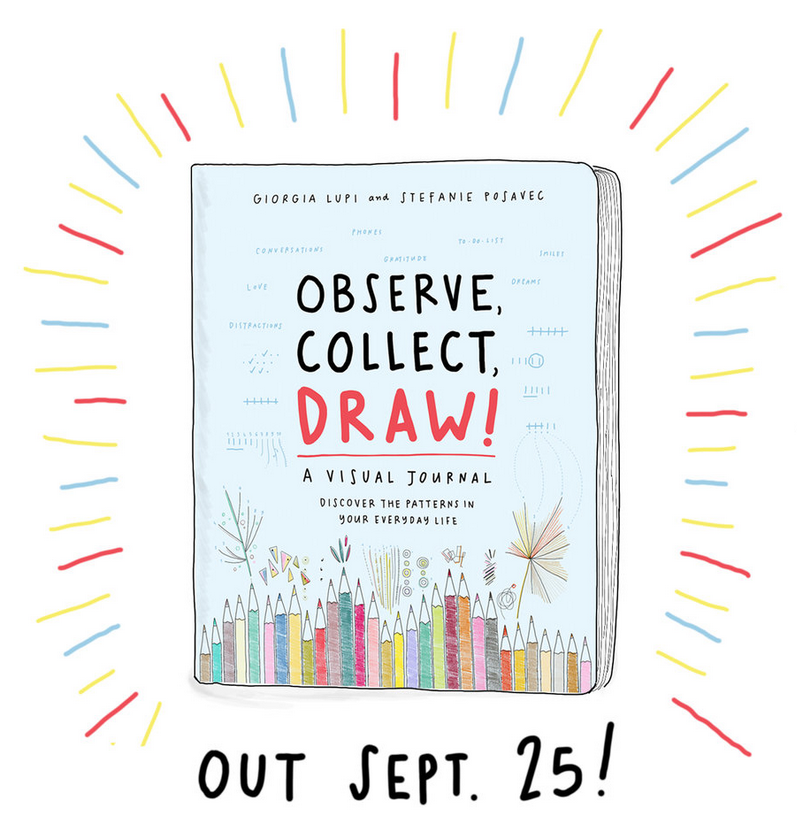
Book: Observe, collect, draw!
Observe, collect, draw – a visual journey by Giorgia Lupi and Stefanie Posavec is the follow-up to their lovely book Dear Data which was about two friends getting to know each other through postcards containing hand drawn and data driven visualisations about various aspects of their lives.
The new book encourages the reader to take action and become creative in collecting and drawing personal data – in a similar fashion as Giorgia and Stefanie did it for Dear Data. The book is grouped into sections. It begins with illustrating how to build a visual vocabulary in a creative way using different shapes, colours and positionings. At the end there are several (almost) blank pages containing nothing more but some ideas about observing, collecting data and finally drawing. So this is for the reader to grab a few colour pens and get creative.
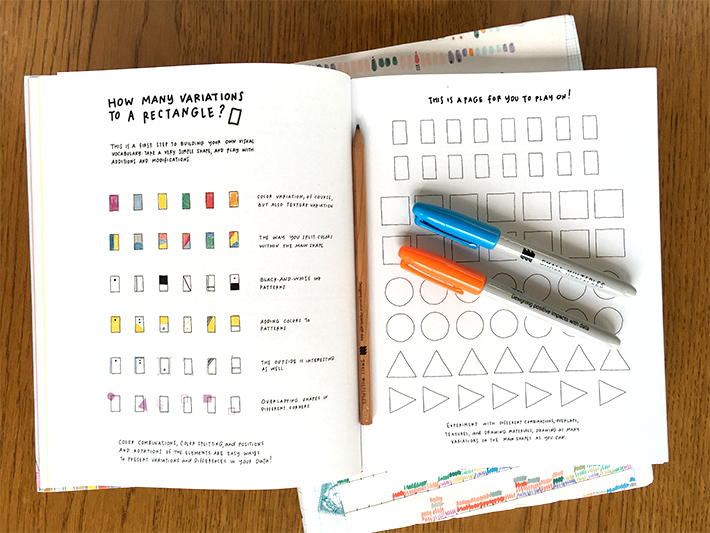
We love the low entry educational barrier this book sets towards visualising data. It’s well thought out with heaps of attention to detail. It’s been out for a while now but we’ve only got our hands on it few weeks ago.
By the way, here’s a list of all the data vis related books that we own at Small Multiples, including some new ones we’d like to get.