See how far your electric car can get you in China

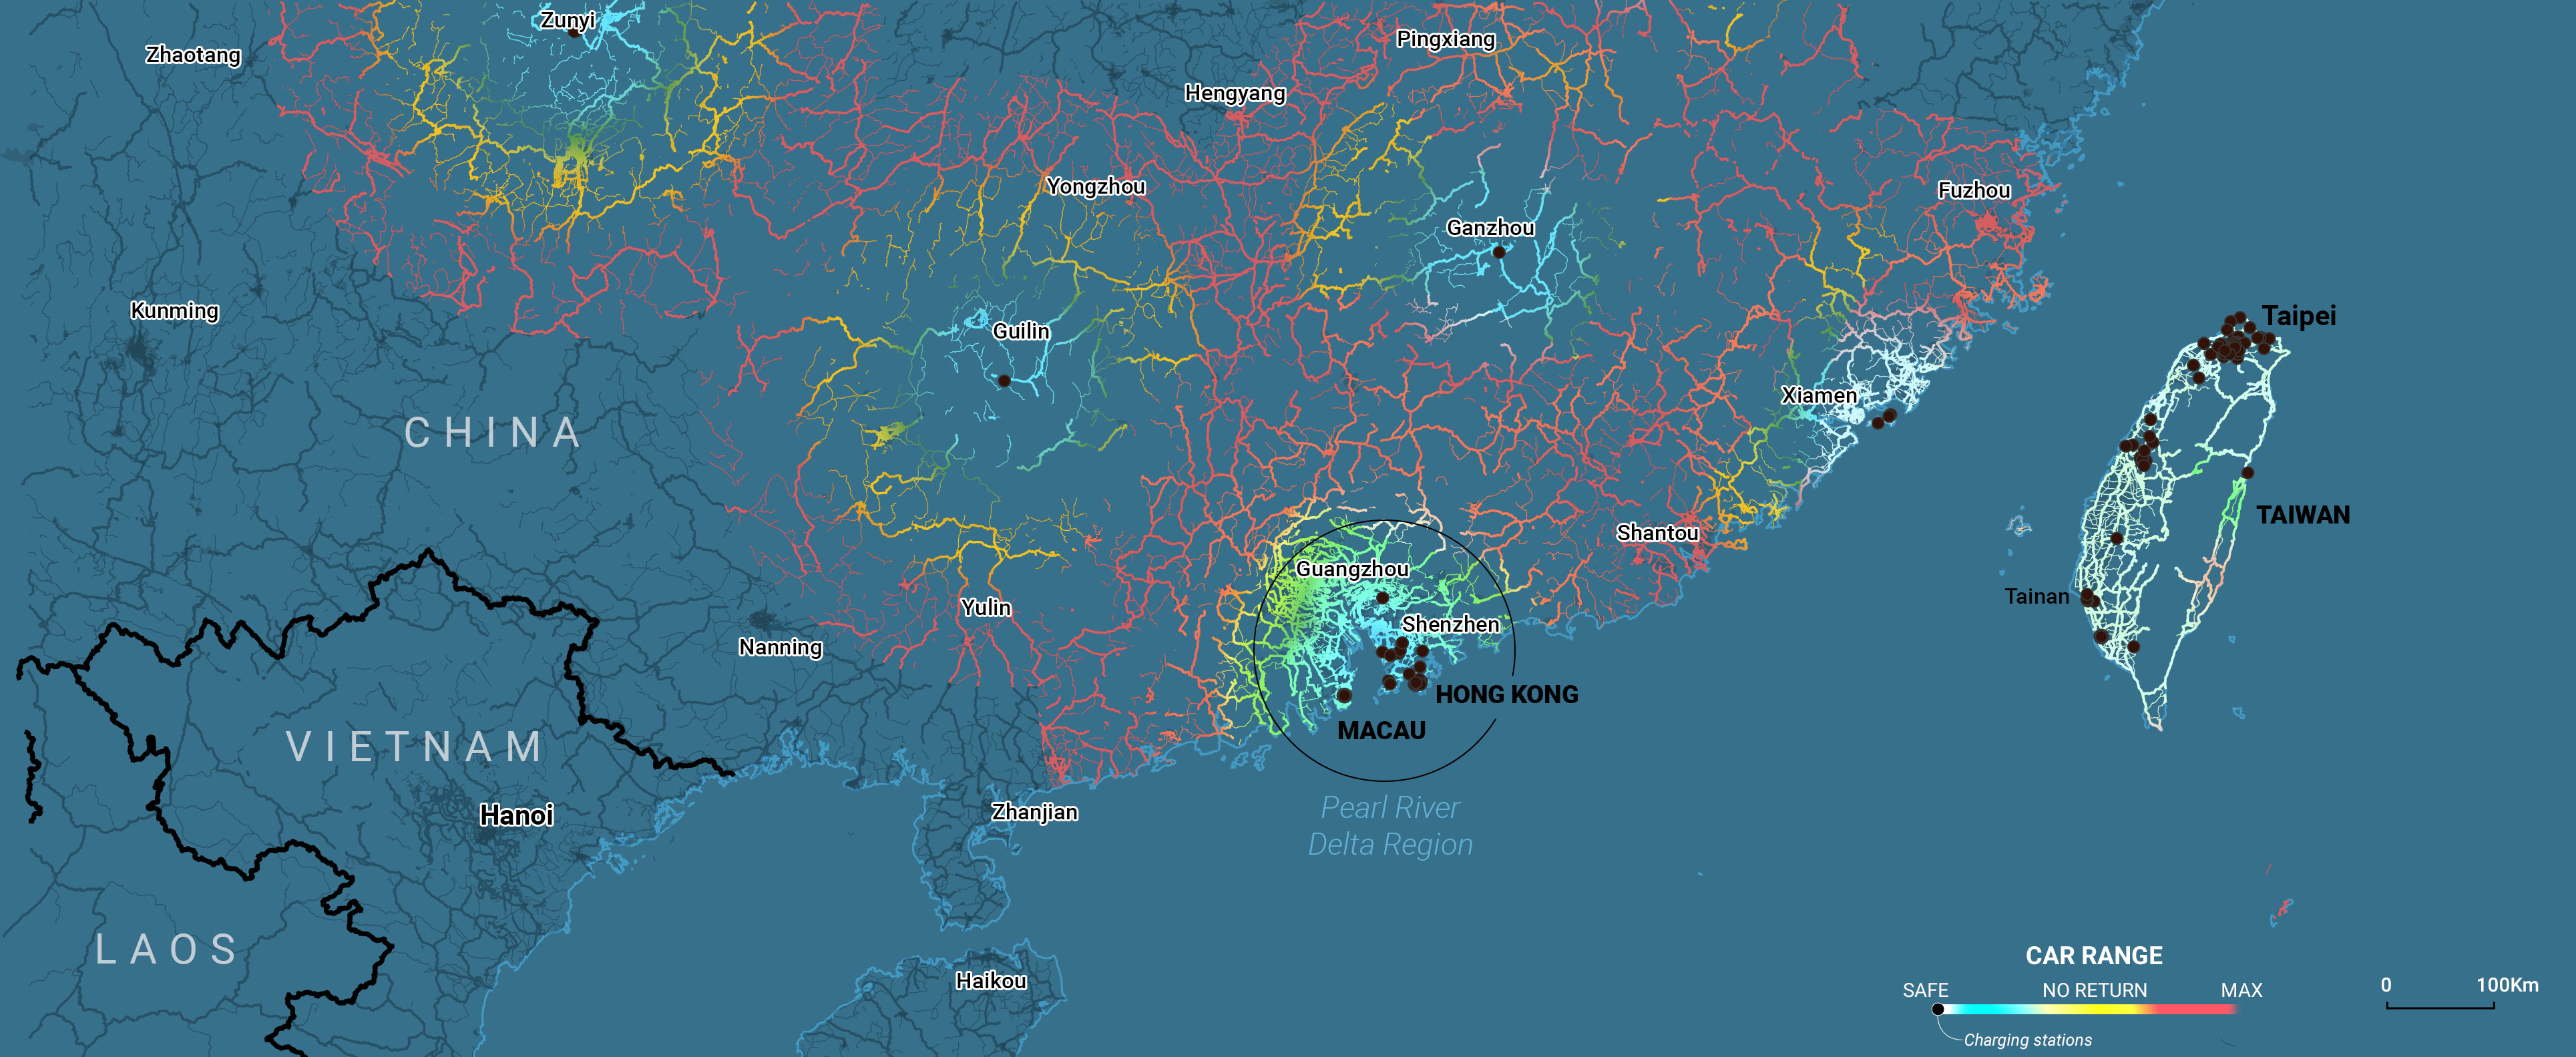
Informative maps showing the range of electric vehicles according to the availability of charging stations in terms of safe for a return trip, no return, and maximum possible distance. By Marco Hernandez at SCMP
Human Terrain – Visualising The World’s Population, In 3D
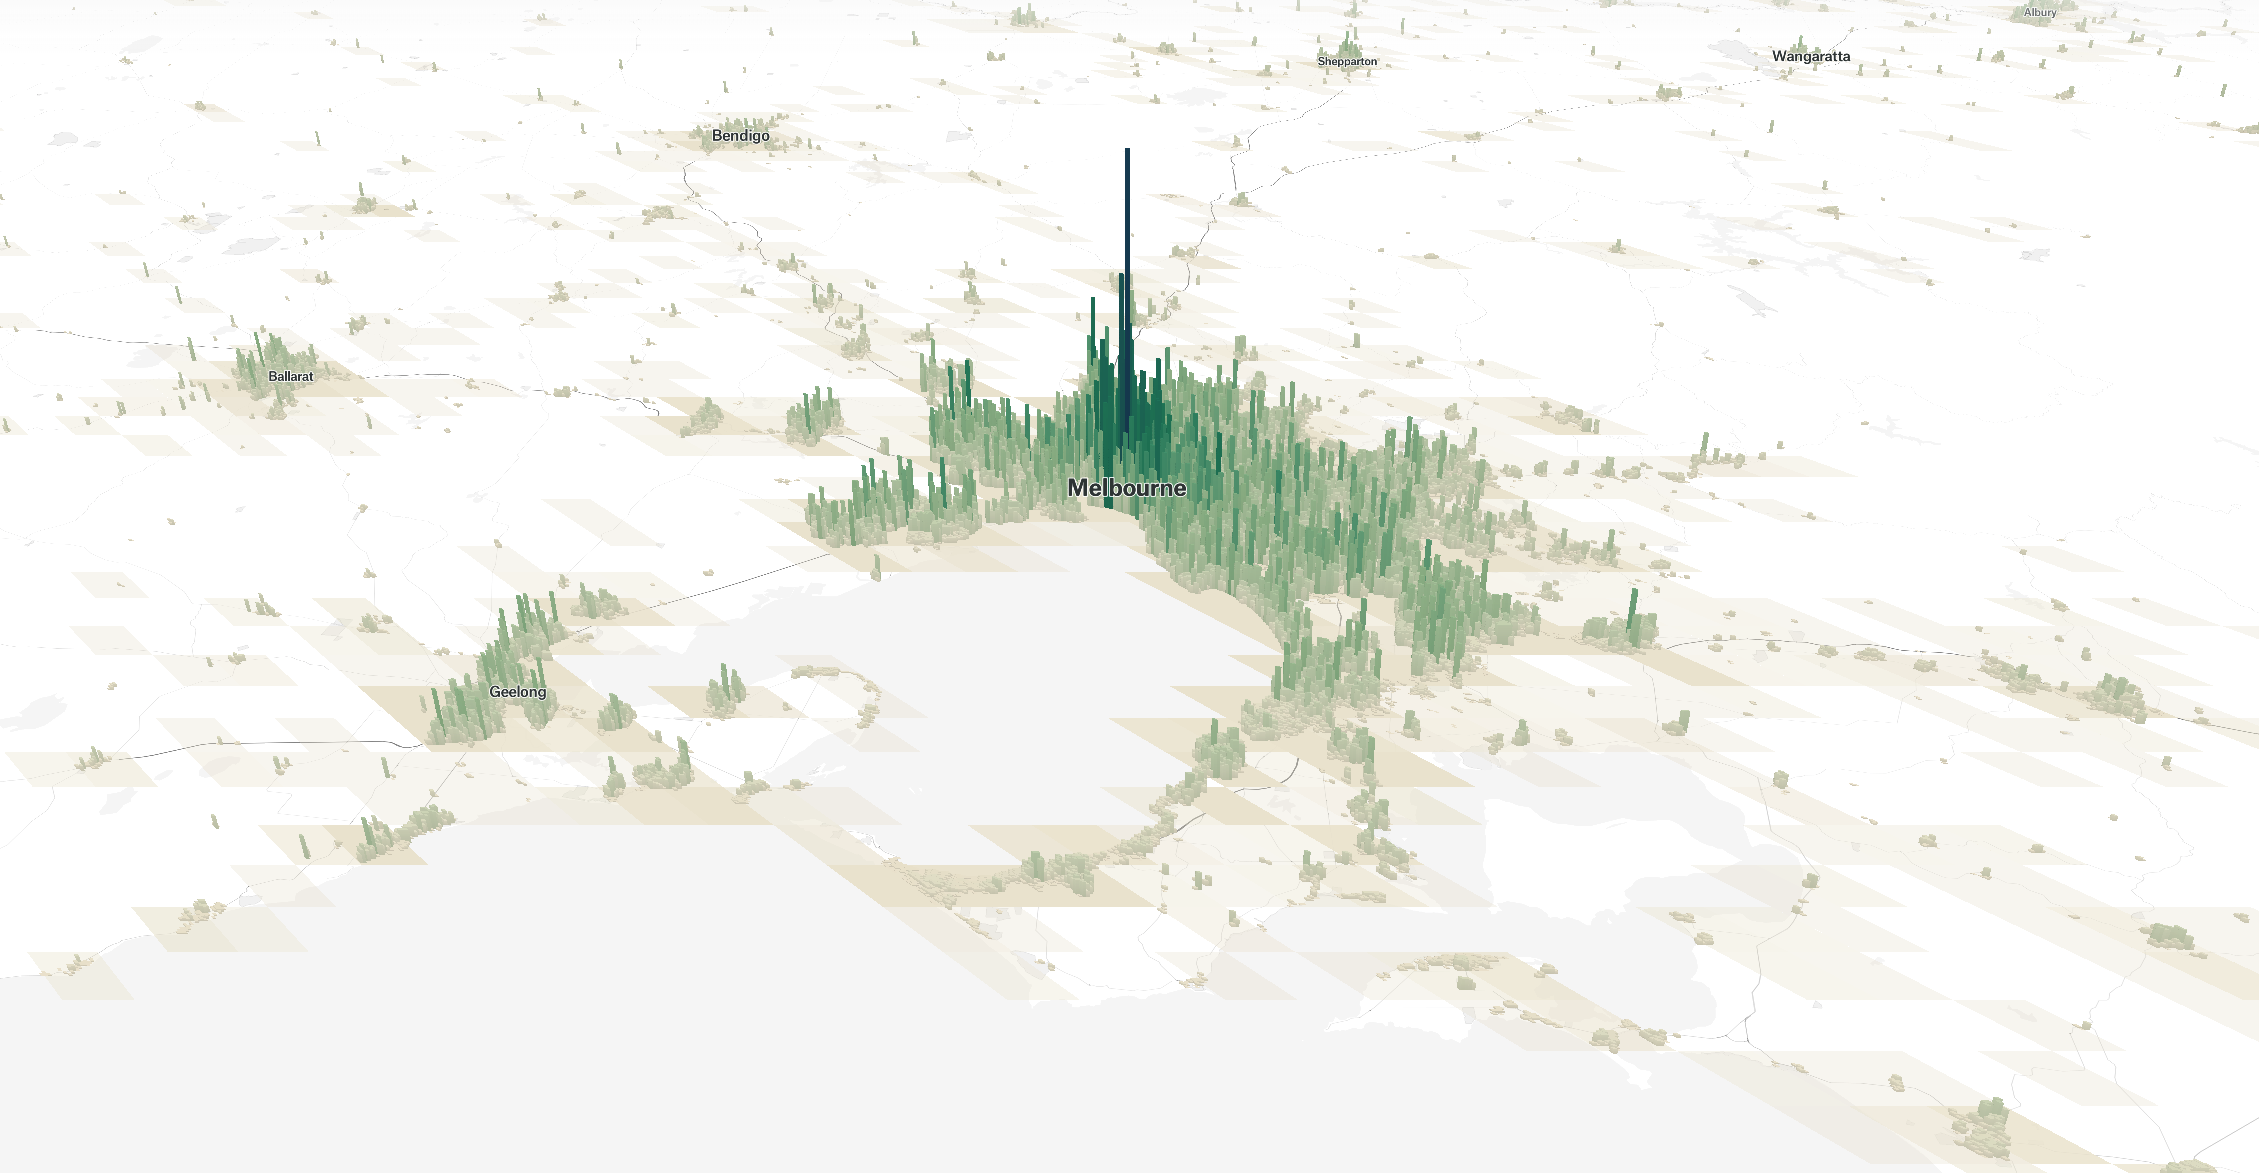
Beautifully designed map and intuitive interactions for a popular topic. By The Pudding
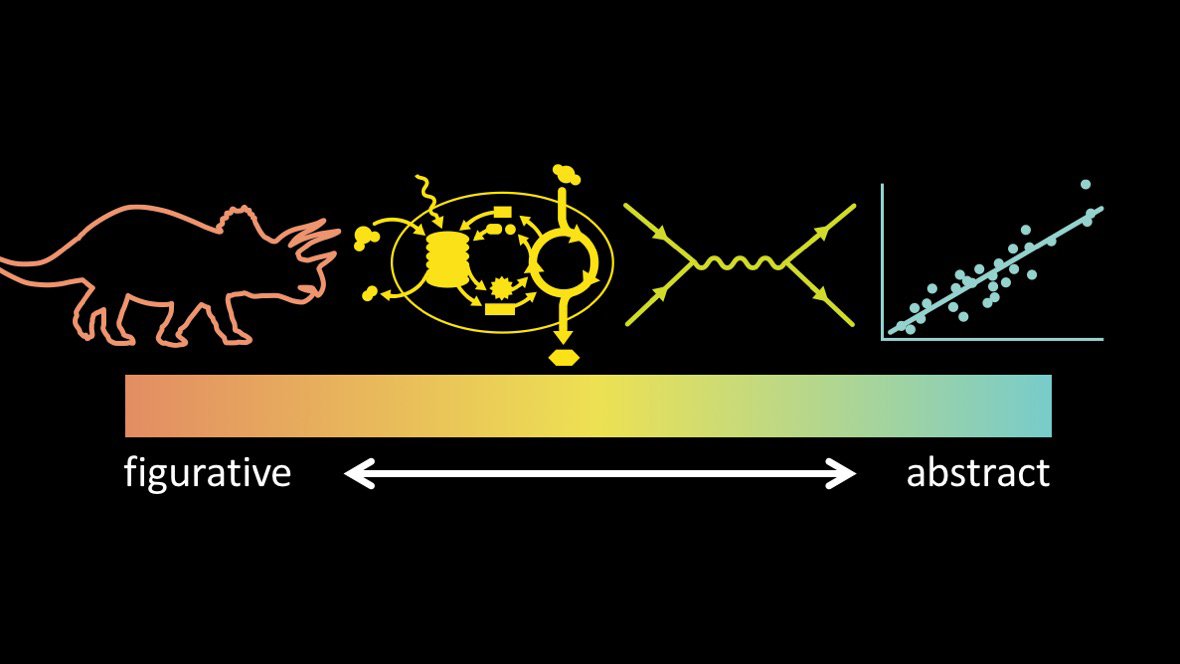
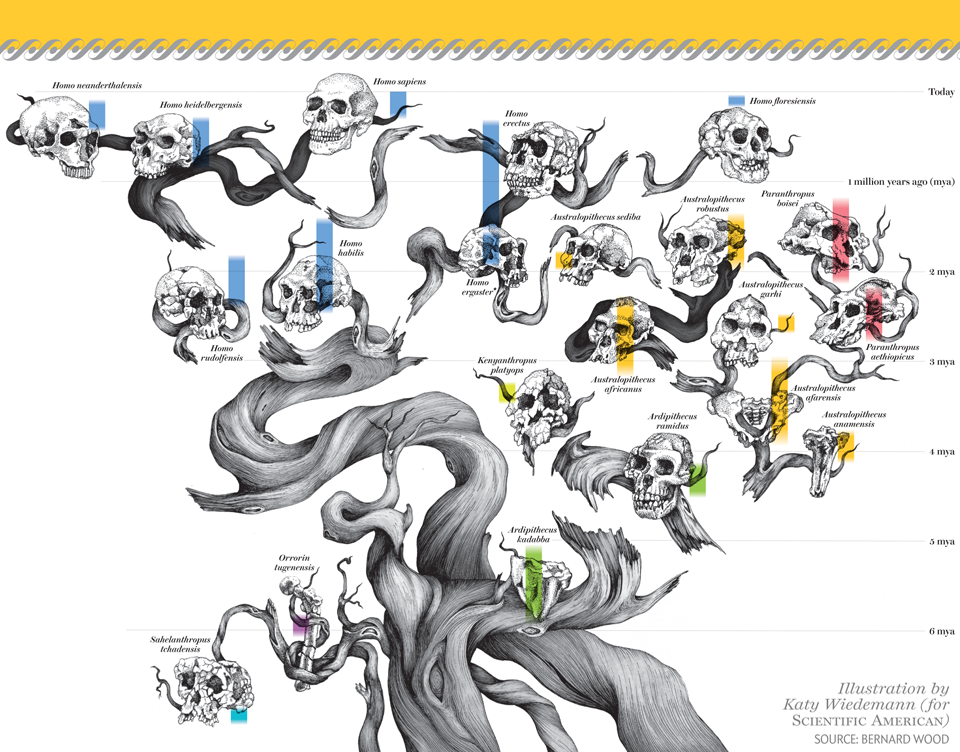
Visualising Science: Illustration and Beyond
Transcript of a talk given by Jen Christiansen. A very comprehensive guide with many good information graphic examples from Scientific American and important lessons for communicators.